

 Products & Services







 400 676 5650
Origin of Value Stream Mapping
The term Value Stream Mapping (VSM) originates from the 1999 bestselling book Learning to See: Value Stream Mapping to Add Value and Eliminate MUDA by Mike Rother and John Shook. They also coined the terms Value Stream Analysis (abbreviated as VSA) and Value Stream Design (abbreviated as VSD), and defined a set of commonly used symbols in value stream mapping.
Value stream mapping is rooted in Toyota’s "Material and Information Flow Diagram," abbreviated as MIFA (Materials and Information Flow Analysis) or MIFD (Materials and Information Flow Design). It provides an effective framework for describing processes, highlighting waste and its negative impact on overall process performance and flow. With the widespread adoption of Learning to See, it has become the standard method for depicting value streams and a starting point for many lean improvement initiatives.
Value stream mapping is a visual representation of material and information flow. As such, it helps you visualize the movement of materials and information on the shop floor. This can be done for the current state of the shop floor (known as Value Stream Analysis, or VSA) or for the future desired state (known as Value Stream Design, or VSD).
Components of a Value Stream Map
A current-state value stream map charts three flows for a lean journey: product flow, which traces the path a product takes through production before reaching the customer; information flow, which shows how information is shared and communicated during production; and material flow, which indicates how and when raw materials are moved and replenished, as well as the quantities involved.

A value stream map consists of three main parts:
1. Material Flow: Depicts the movement of materials, from raw materials through each major operation (equipment, containers) to finished goods moving toward the customer. This is a high-level view that shows only the key parts of equipment or processing systems, along with all inventory along the process. Critical suppliers or supplier groups are shown as inputs, while warehouses, distribution centers, and customers are depicted as outputs from the factory.
2. Information Flow: Shows the flow of all major types of information that determine what and when to produce. This begins with customer orders and traces back through all significant processes—forecasting, demand management, sales and operations planning (S&OP), and scheduling—ending with scheduling and control signals to the production floor and order releases to suppliers.
3. Timeline: Displays value-added (VA) time in contrast to non-value-added (NVA) time. It is a line at the bottom of the value stream map, shaped like a square wave. This is a key indicator of waste in the process. It shows the effect of waste but not its causes, which should be diagnosed from the other two components of the value stream map.
Utility of Value Stream Mapping
The information flow portion of a value stream map helps us better understand why raw material inventory is so high. This is a clear example of the benefit of displaying material and information flows on the same value stream map, and why Toyota chose to do so when they began drawing "Material and Information Flow Diagrams."

1. Value stream mapping helps you understand material and information flow, enabling you to see problems and inconsistencies. Much of what is learned from information flow is triggered by trying to understand the causes of waste in material flow. Questions to consider include:
- How are customer orders processed? Are there delays in the order entry process? Do these delays impede material flow and create inventory? Do they prevent a make-to-order (MTO) or finish-to-order (FTO) strategy?
- Is the current primary strategy make-to-stock (MTS), make-to-order (MTO), or finish-to-order (FTO)? Is this the most appropriate strategy? Does the manufacturing cycle allow for FTO or MTO?
2. Information processing itself can also contain waste, so it is equally beneficial to focus on information flow and consider what additional waste might exist. Areas to analyze include the following:
- Are planning and scheduling processes based on real-time collected information, or on information that has been batched and is no longer current?
- When processed information is transformed, is the result transmitted directly to those who use it, or does it pass through other non-value-adding nodes? Do all who need the information receive it? Do those who do not need it also receive it?
- Does the information flow show many back-and-forth loops between information processing steps? What are the reasons for these loops, and can they be reduced?
- Does the customer receive appropriate feedback on order status? Are they consulted about future needs? Are demand management and forecasting processes properly leveraging this?
3. Value stream mapping helps you understand material and information flow, enabling you to see problems and misalignments between information and material flow.
Common scenarios for using value stream mapping:
- Designing a new production line or planning a new product layout;
- Improving material and information flow in an existing production line on the shop floor;
- Determining lead time and replenishment time in a flow shop;
- Reducing unevenness in material and information flow in a flow shop.

Purpose of Value Stream Mapping
The purpose or goal of lean work can be reducing costs, shortening lead times, increasing customer satisfaction, eliminating frustration, improving quality, etc. The specific goal is not important; what matters is consensus on the goal so that improvement efforts align with achieving it. For those engaged in improvement work, communicating the goal is important to build consensus.
Taiichi Ohno once said that when considering the absolute elimination of waste, keep the following two points in mind:
1. Efficiency improvement is meaningful only when linked to cost reduction. To achieve this, we must start producing only what we need with the minimum number of workers.
2. Look at the efficiency of each operator and each production line, the efficiency of operators as a group, and the efficiency of the entire plant (all lines). Efficiency must be improved in every process, while also improving the efficiency of the entire plant.
The stated goal of value stream analysis is to evaluate processing time and setup time, with the implicit purpose of improving processing efficiency: the ratio of processing time to setup time. The application of value stream mapping is not a strategic issue but an operational one.

Applying value stream mapping to increase value-added and eliminate waste is meaningful only when it serves a purpose: helping to understand how the system fits together, how each role supports the overall picture, and analyzing waste at various levels to serve that purpose.
If we do not keep these points in mind, what problems might we encounter? Are we spending time, resources, and effort on work that does not support our goals or objectives? Are we eliminating waste that is necessary or valuable to the system from a personal perspective? How do we understand how the entire system fits together? With product design and process already established, the current challenge is to make it work through process improvement. Applying value stream mapping to eliminate waste, while a good idea, is hard-pressed to change the game rules (if detached from the enterprise’s purpose—profitability—and merely for improvement’s sake).
Value stream mapping is a critical first step in lean implementation because it eliminates a lot of complexity and confusion—it is based on gemba facts. Drawing a value stream map provides a high-level view of the entire process, not isolated efficiencies from individual units or operations. The mapping process involves examining and recording all activities that occur from raw material to finished product. The value stream map includes all data relevant to the end customer and can identify value-added and non-value-added activities.
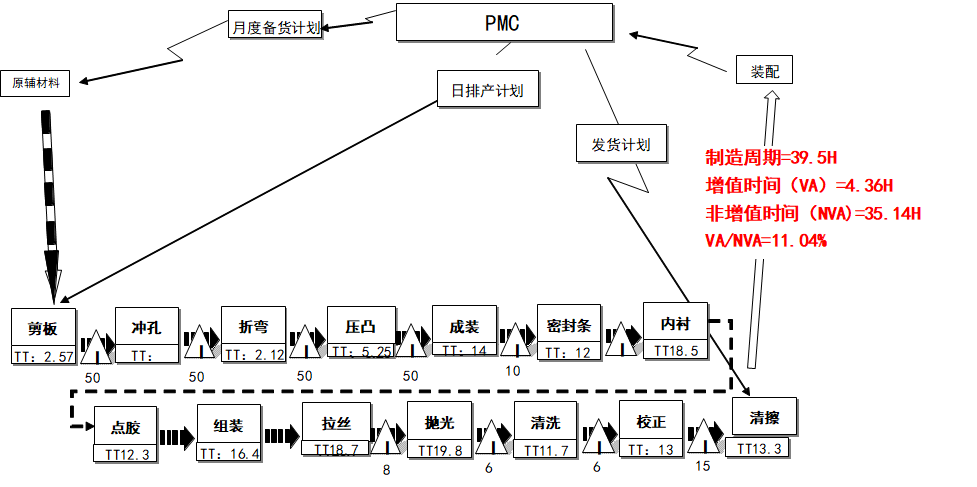
A value stream map is a method for visually describing a production process—the physical flow of materials and how value is created for the customer. It shows key process steps and data related to process, quality, lead time, and capacity relative to takt time. It also includes a diagram of information flow and processing that manages, controls, or influences the flow of material logistics. The third component is the timeline, which illustrates everything that impacts short lead times. Value stream mapping is a key lean tool for understanding where waste occurs in a process and how to improve to reduce or eliminate waste:
- It provides an understanding of how value is created for the customer.
- It gives everyone on the team a shared understanding of the entire process: people generally know their own work area well but have only a vague idea of upstream and downstream process details.
- It highlights key areas of waste in the process.
- It describes material and information flow (often observed for the first time; what you see is what you get, recording the information as first seen rather than averaging multiple observations), making all interaction points ("touchpoints") apparent.
- It provides clues to the root causes of waste, including improper information handling, dysfunctional scheduling, and more.
- It forms a template for designing improvement plans and becomes the starting point for the future state.